The one who builds the pipeline and the one who writes the story.
It regularly collects data sitting in different systems, stores it compressed in an open file format, and turns it into charts, tables, and dashboards without a single line of code. The data engineer sets up the pipeline with a four-step wizard; the analyst drags fields onto shelves. Neither writes code, and neither waits on the other.
The chain the market sells as three products, three invoices, and three support lines is gathered here in one place: move, store, and show. All of it in one product.
When the pipeline is done, analysis does not start from scratch. BILake carries the same data without a break — from connection to load, from the BILake Lakehouse to the dashboard. There is no other product in between, no other team waiting, no other copy of the data.
01Source02Intake03Shrink04Query05Decide
01ConnectPostgreSQL, Kafka, MySQL… 75+ connector types enter through the same door.
02–04BILakeIntake → shrink 70% → query. Data lives as open Parquet files in the BILake Lakehouse.
05DecideThe dashboard opens in 59.4 ms; SQL Lab and AI read the same data.
01Connect75+ connector types; credentials stored encrypted, defined from a single screen.
02MovePick one of 8 load methods; if it interrupts, the run resumes where it left off.
03StoreData sits as open Parquet files, with version history, in your own storage.
04QueryBILake Nodes serve the request from memory; not a single dashboard query hits your production database.
05DecideOn a dashboard that opens in 59.4 ms, everyone looks at the same current data.
ETL+BILake Lakehouse+Self-service BI= One product
The data engineer builds the pipeline. The analyst does not wait.
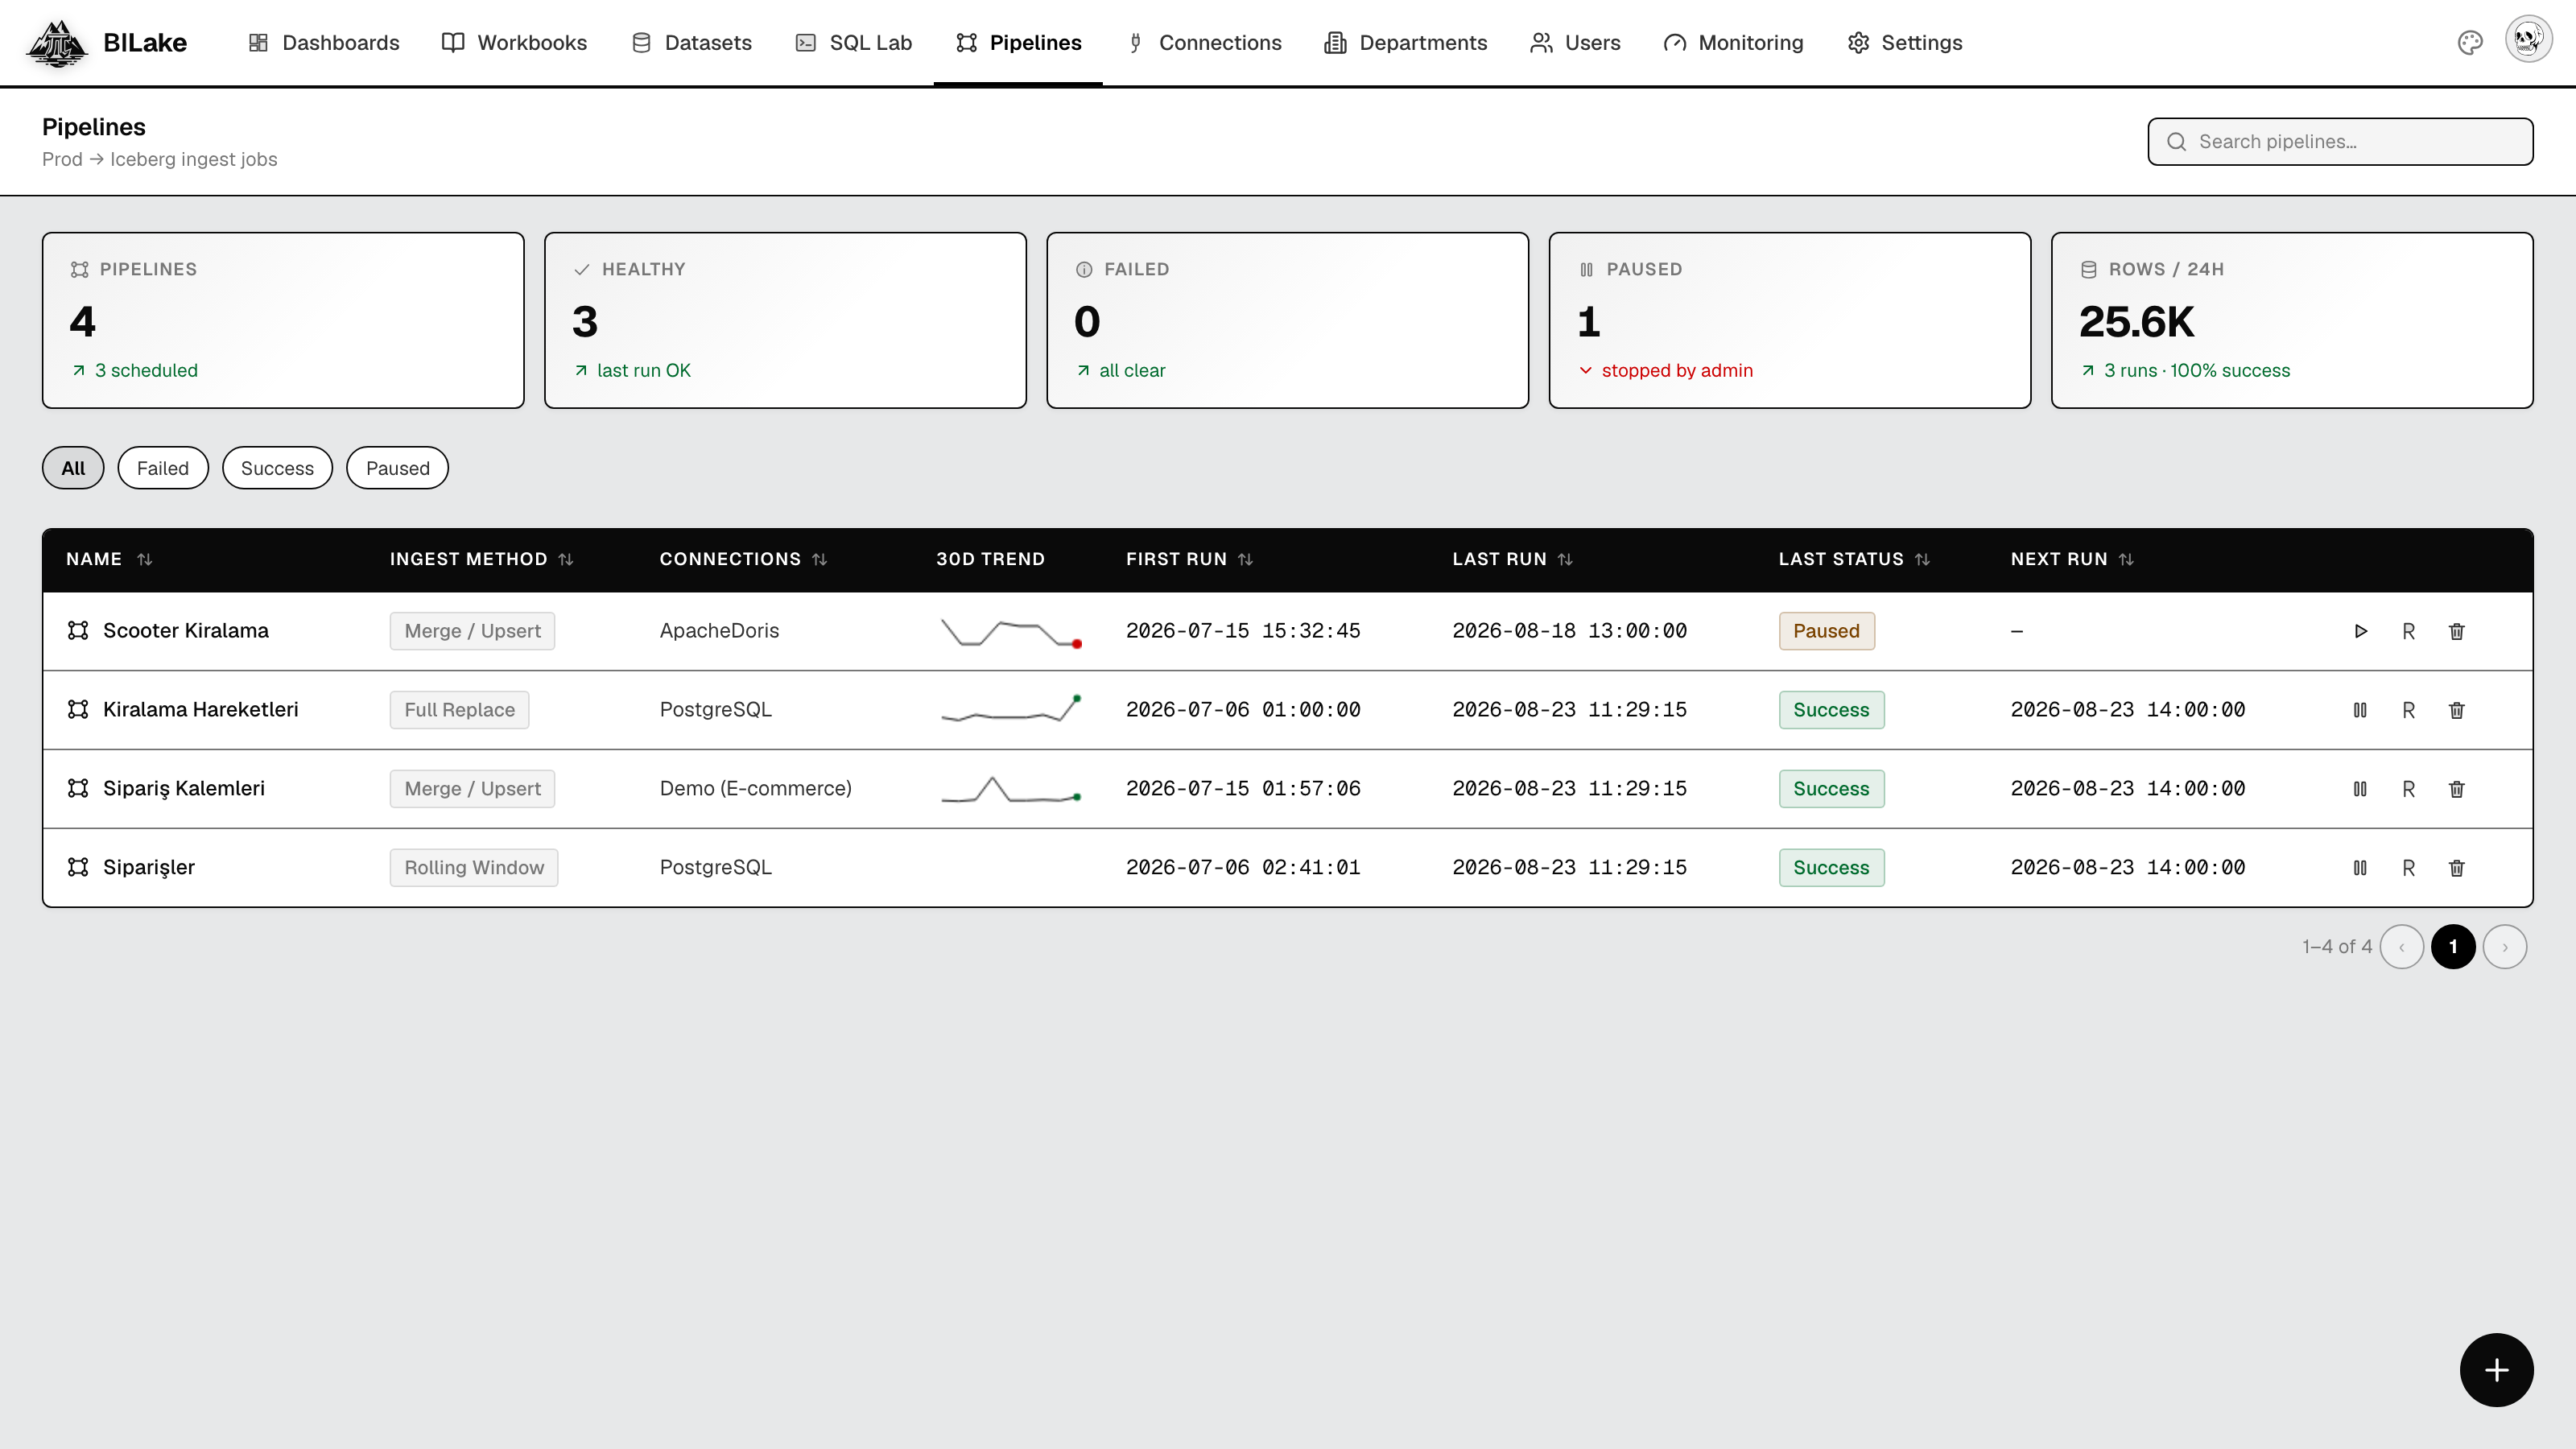
Two different roles work inside the same product, on the same data. While the engineer manages load health and scheduling, the analyst builds a chart on data that is current at that moment. Handoff files, “when will you add the column” emails, and weekly sync meetings disappear — because the gap between them has disappeared. Building a pipeline is a four-step wizard: source, columns, method, schedule.
Data engineerBuilds pipelines · schedules them · watches health
LoadSAME DATASETAnalyze
Data analystPicks fields · builds the chart · shares it
Every method is a ready answer to a different job8 load methods
Full RefreshRewrites the table from scratch on every run; for small reference tables.
AppendTakes only new rows; for immutable event and log streams.
Merge / UpsertUpdates by key, inserts if missing; for orders and customer records that keep changing.
Delete + InsertDeletes a given range and rewrites it; for periods that get restated.
Sliding WindowIncremental loads period by period; for daily sales, hourly metrics, and other time series.
Truncate + LoadRefreshes the contents, keeps the structure; for tables that are fully refreshed every time.
SQL MaterializationThe result of the SQL you write becomes a persistent table in the BILake Lakehouse; heavy joins are computed once.
Historic Dimension (SCD2)Versions history; answers “which segment was this customer in last quarter?”
Interruption is not a problemA load that stops mid-run does not start over; it finds the missing ranges and finishes them.
No state to corruptProgress is not kept in a separate state table; it is derived from the target table. “State corruption” is not a failure class in this product.
Memory independent of sizeData is processed as a stream; the first large load is sliced in parallel and the table is queryable from the first fragment.
Row-level verificationAll 8 methods are verified on every release against real databases — 28 tests and a 200,000-row matrix of 60 combinations.
Compression of up to 70%.
Source systems keep data row by row, with its indexes, on expensive operational disk. BILake writes the same data columnar and compressed, and stores it on cheap object storage: a 100 GB dataset lands at about 30 GB. Storage cost falls; the data stays queryable. Because it sits in an open file format, it remains the property of all your modern tools, not only of BILake.
Sample raw data100 GBBILake Lakehouse~30 GB
70%less
Source system100 GB
→compress
BILake~30 GB
100 GB of analytical data → about 30 GB in the BILake Lakehouse · the ratio depends on the data shape
If you know the question, you do not need to know SQL.
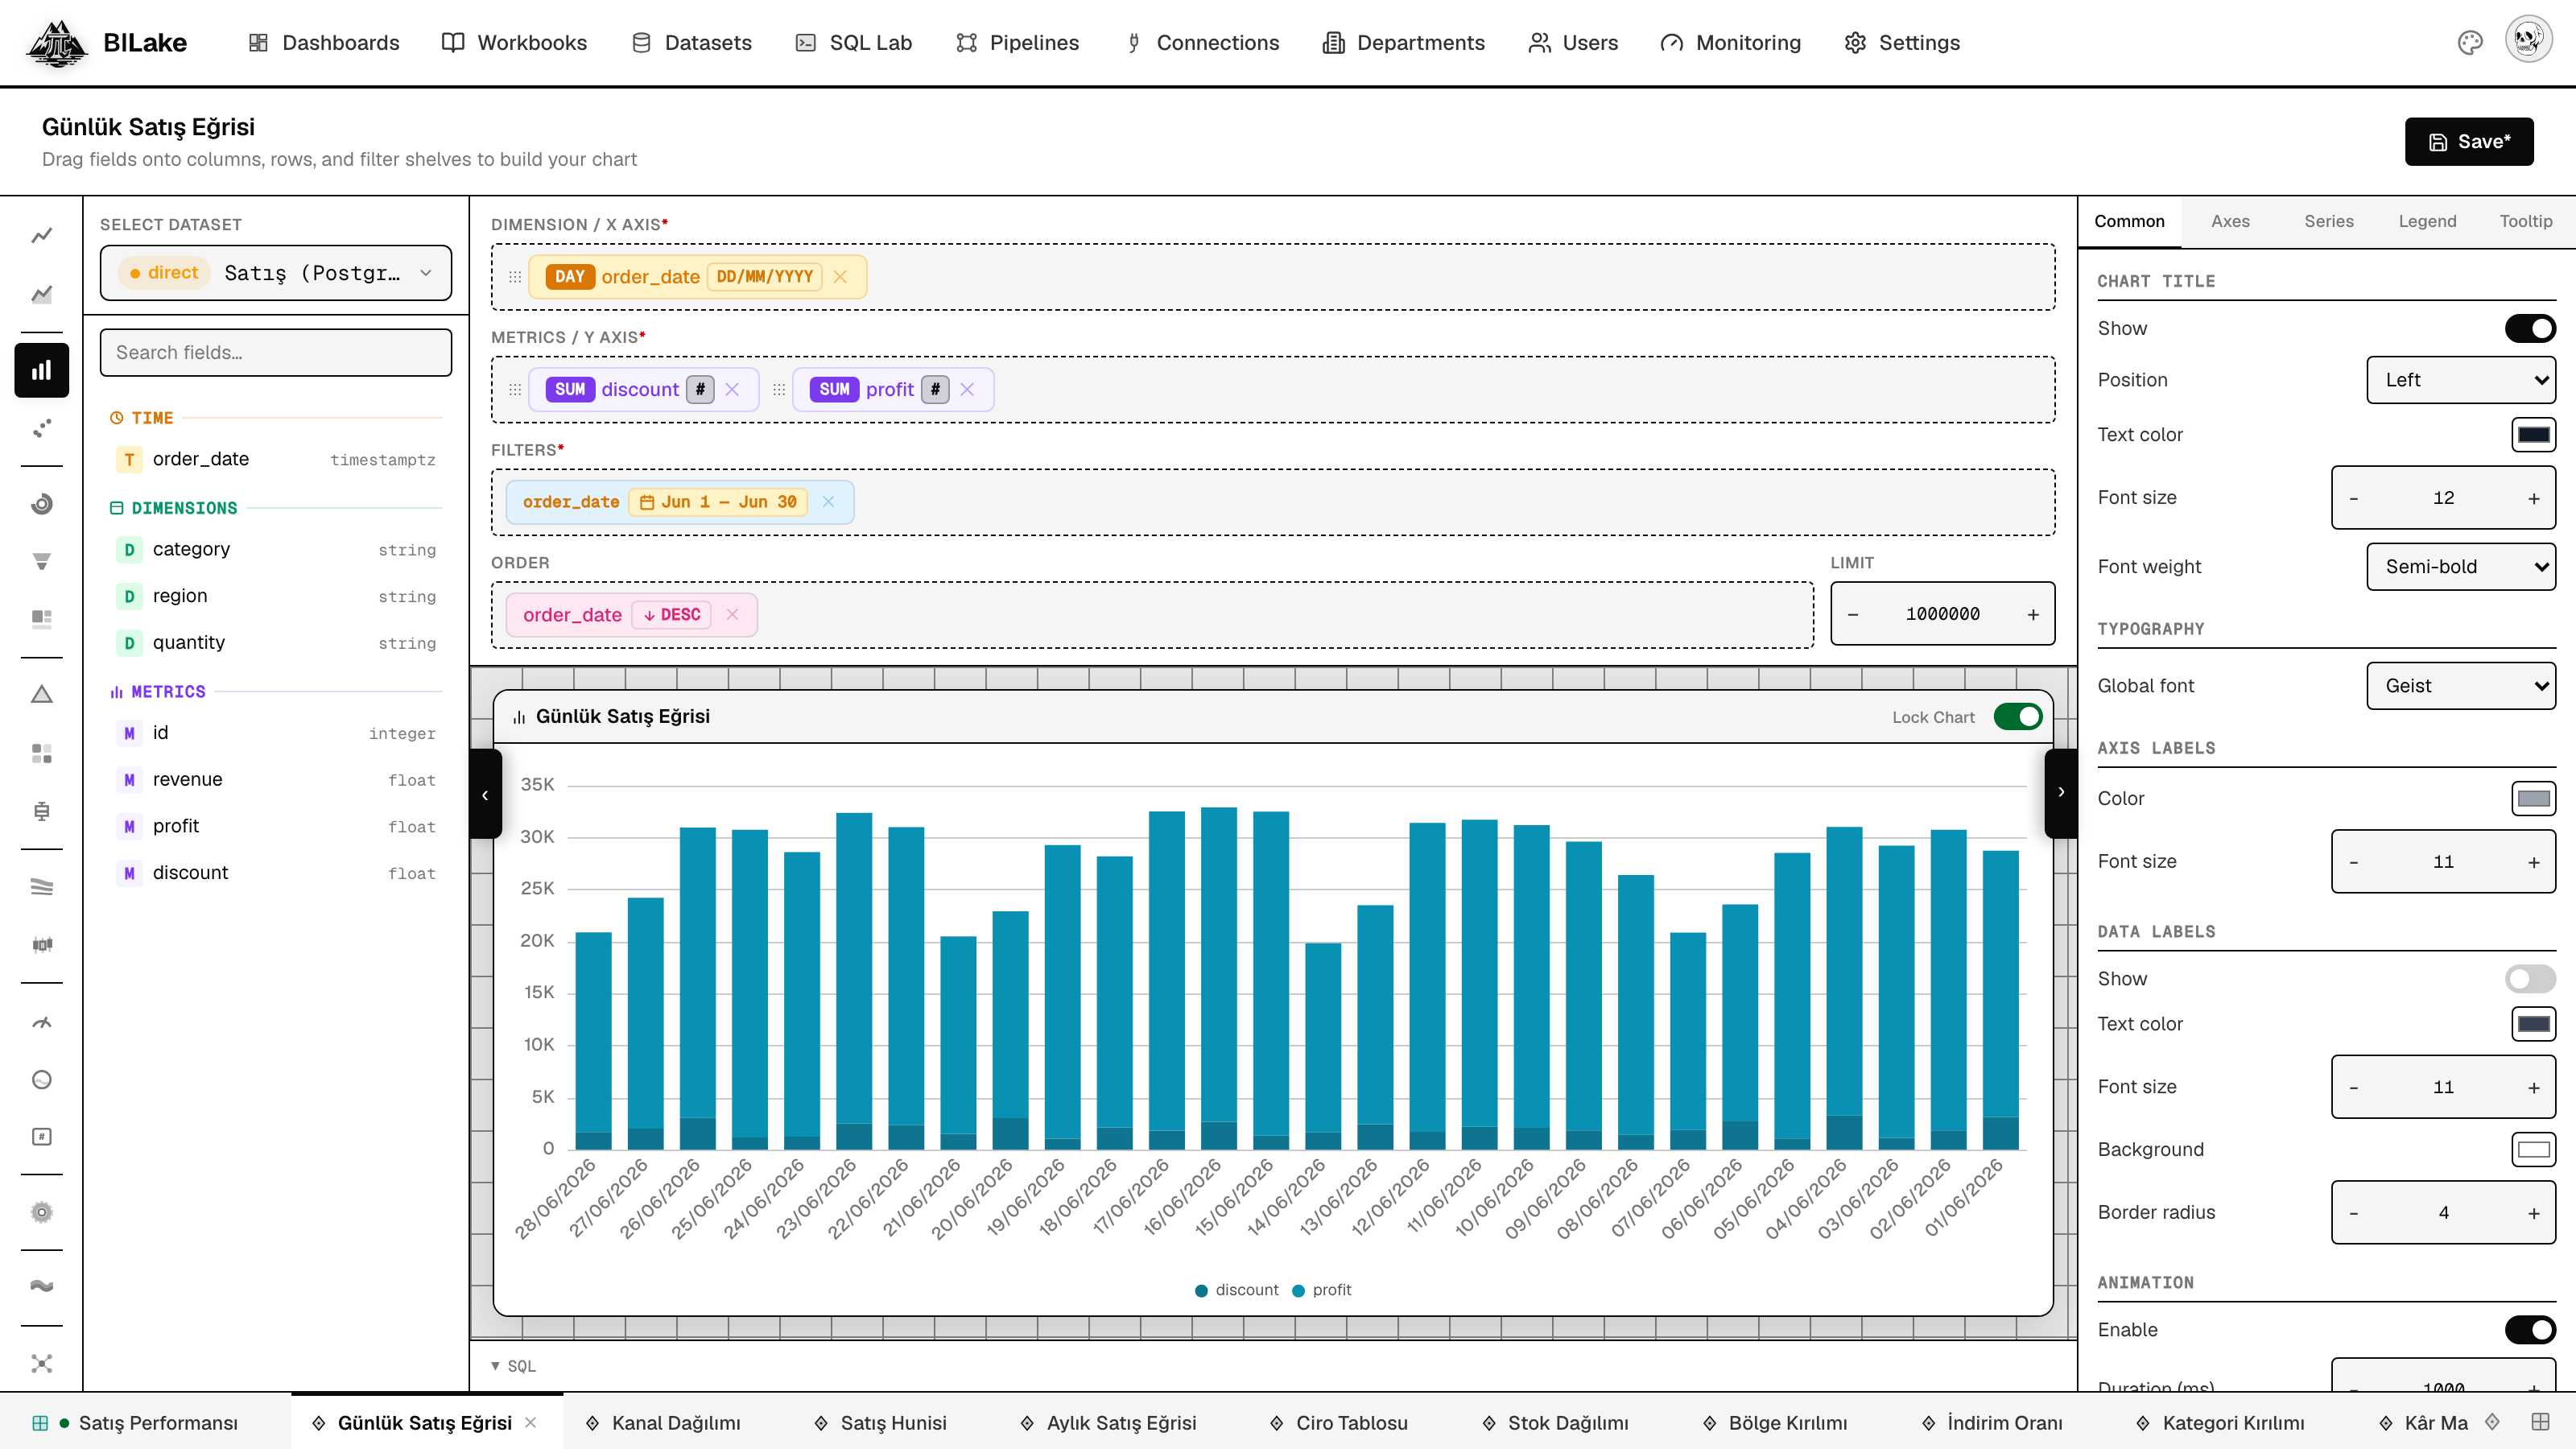
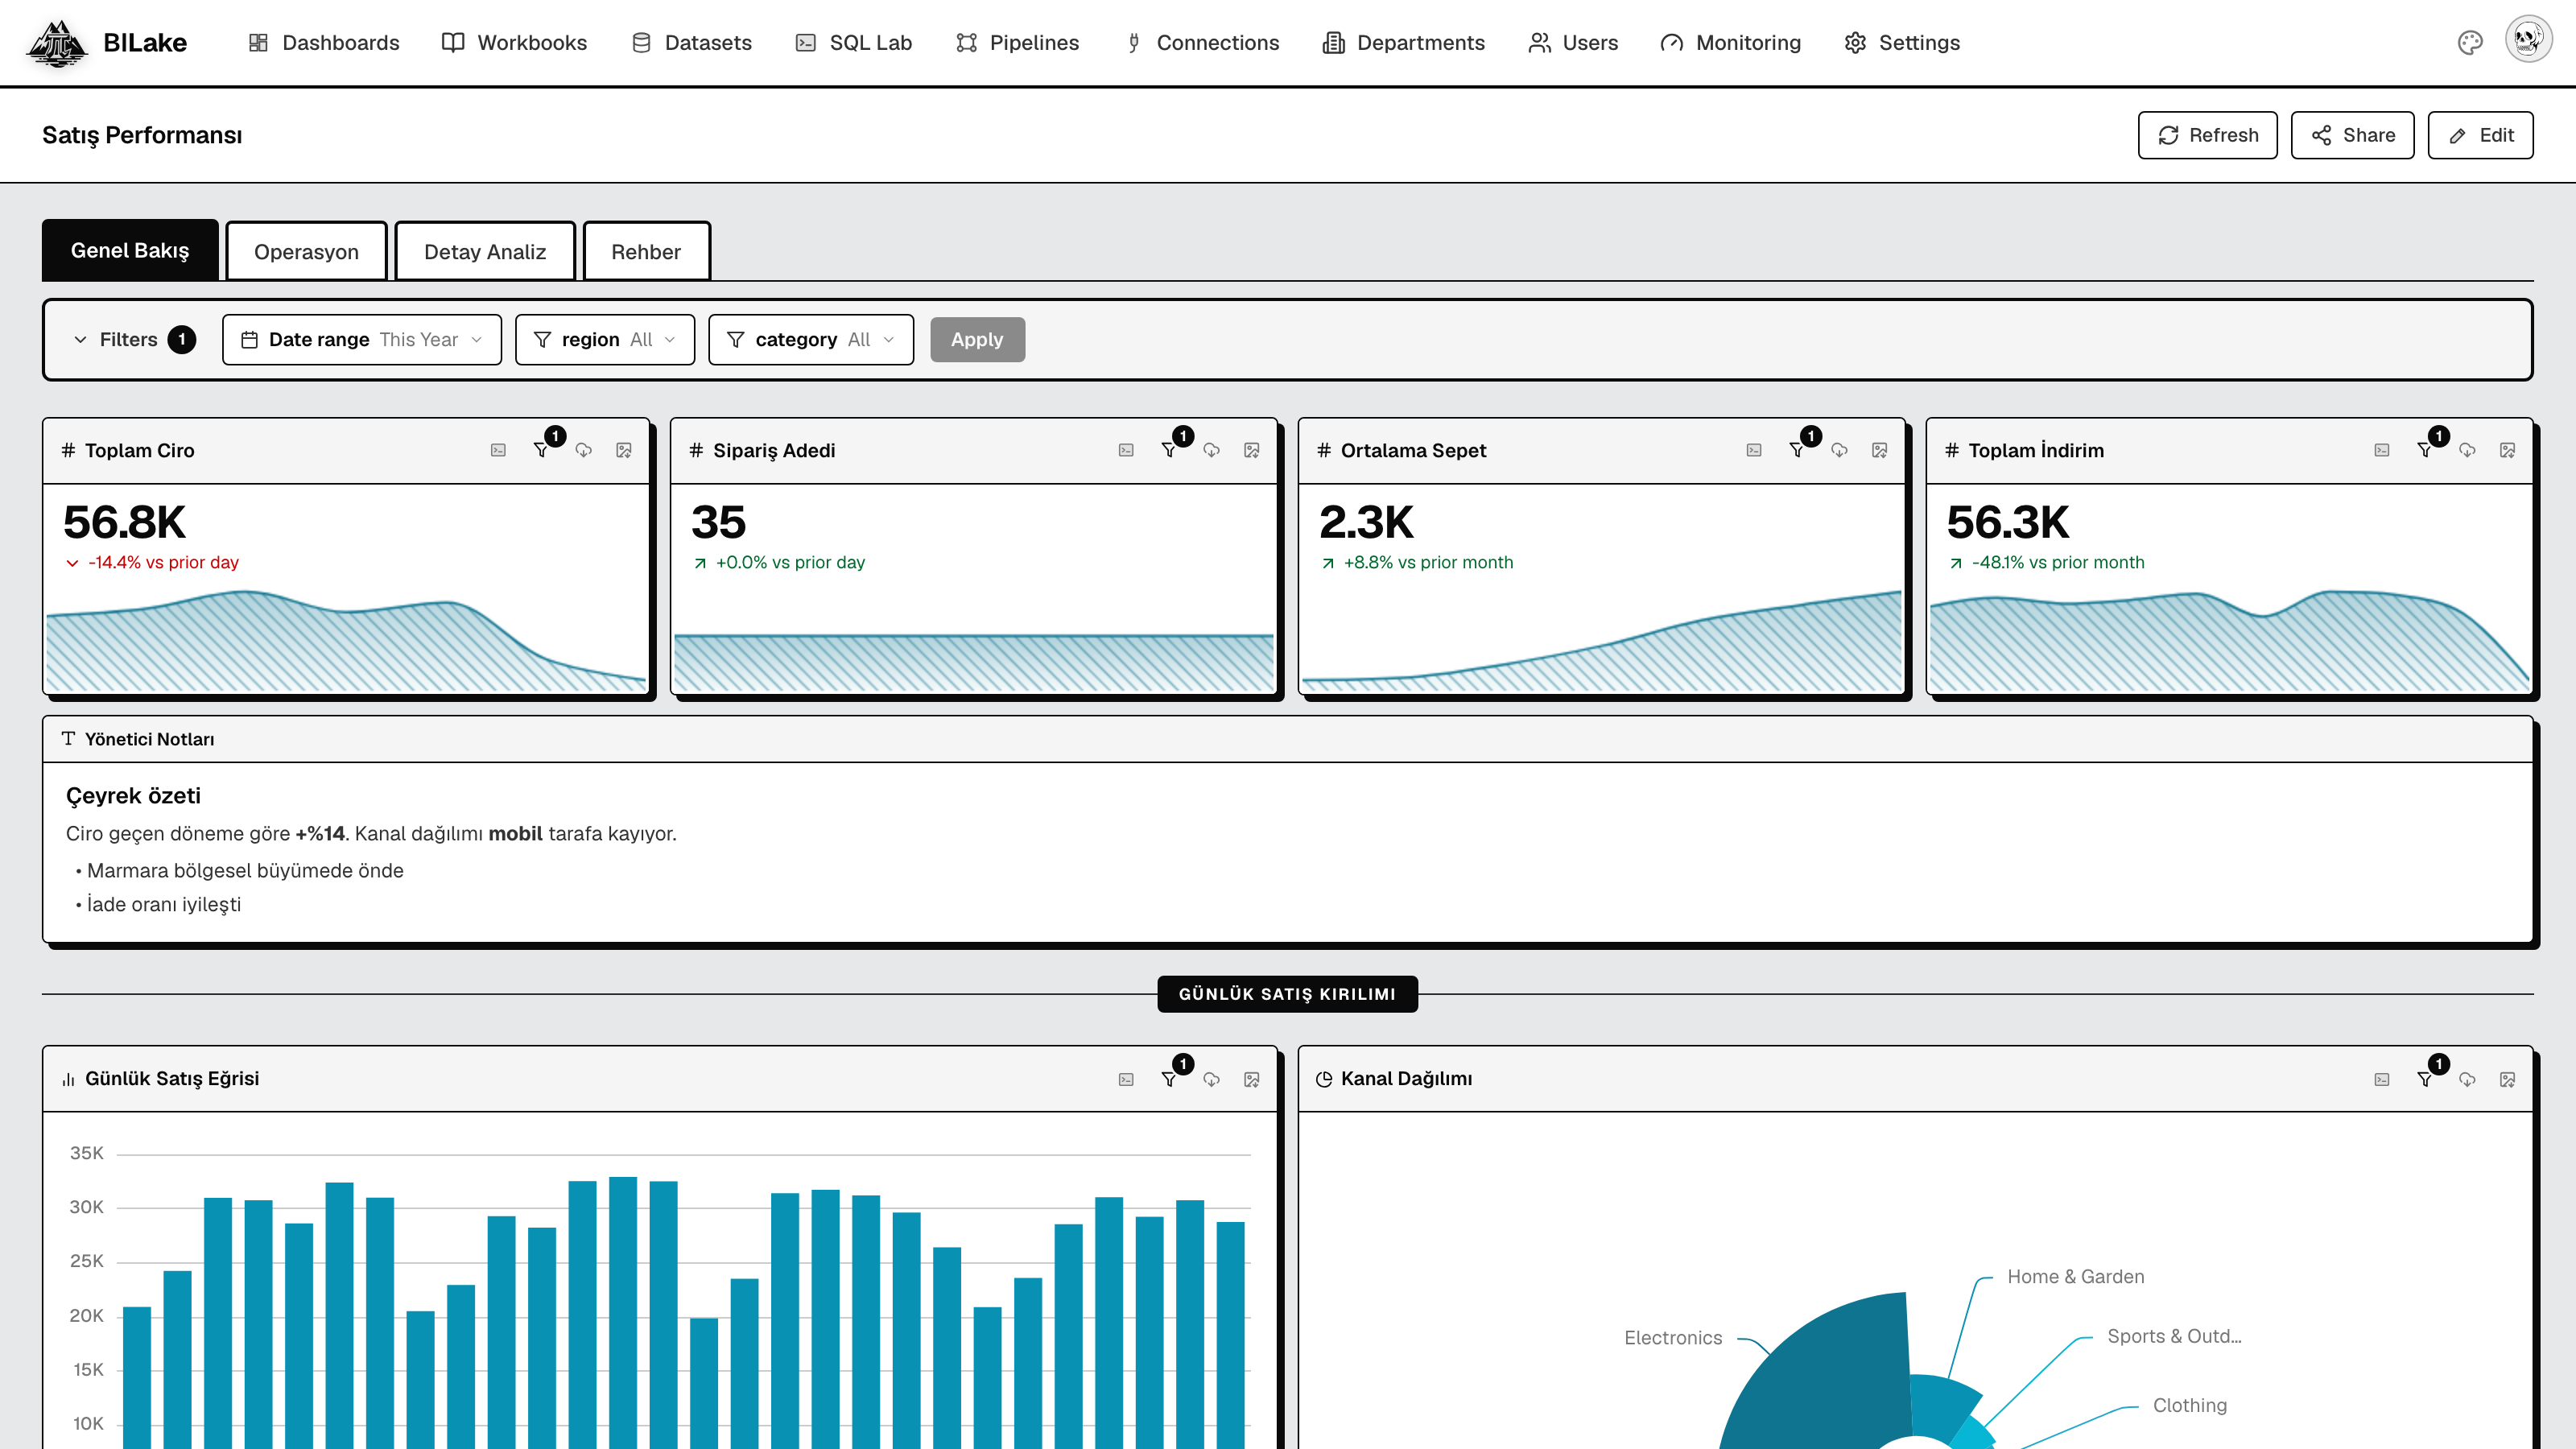
Most people in an organization do not write SQL, and they should not have to. Building a chart is drag-and-drop: columns go onto dimension and metric shelves, one of 20 chart types is picked, the result appears immediately. Totals are ready: six aggregation functions and six date grains from year to hour are picked from the shelf. Self-service here is not a black box: the generated query is always visible, a SQL-literate user can take it further in SQL Lab, and can even turn the result into a persistent table with SQL Materialization so it becomes a shared dataset for the team.
Select a field→Drop it on a shelf→See the chart→Publish to a dashboard
First · WorkbookFields drop onto shelves · the chart draws live · SQL: 0 lines
Drag-and-dropPUBLISH →59.4 ms
Then · Dashboard liveFilter, tabs, sharing · everyone looks at the same current data
All of them share the same shelf model20 chart and table types
20 chart typesFrom line to sankey, heatmap to network; all with the same drag-and-drop flow, no hunting for plugins.
DashboardMulti-page tabs, date and pick-list filters, note blocks; live viewer avatars show who is looking right now; share outside the organization with a timed, revocable link; manage access by department.
Power userSchema explorer, query history, and SQL Lab with export; one language no matter the source, and the result can be materialized into a persistent table.
Dashboard traffic never touches your production systems.
Even when everyone opens the same dashboard at month-end, your operational database does not see that load: BILake serves dashboard requests from its own read layer, through BILake Nodes; the source system is touched only during planned data intake. A page with twenty charts does not fire twenty queries; requests are batched, and the data for frequently used dashboards is warmed before the user arrives.
Dashboard response time · concurrent users59.4 ms p95 · measured
200concurrent users45,622requests0errors0production DB queries
The answer comes from memory, not diskRAM vs disk
Classic approachA disk read and index scan on every request
the wait queue grows
BILake NodesColumnar data in memory; aggregations return from RAM
59.4 ms · p95
The BILake Lakehouse keeps data in a form you can decide on.
A lakehouse is not just a storage folder. Analytical tables stay as standard Parquet files in your own S3; BILake versions those files, maintains them, and always serves dashboards the last completed view. Tables prepared with SQL Materialization live in the same layer, with the same guarantees.
BILake Lakehouse
Data lives on your infrastructure. How it is used lives in the product.
Even if you leave the product one day, your data stays in place and readable by any modern tool: not locked, and not a copy. Because the files sit in an open format, the exit cost is zero; the guarantees live inside the product.
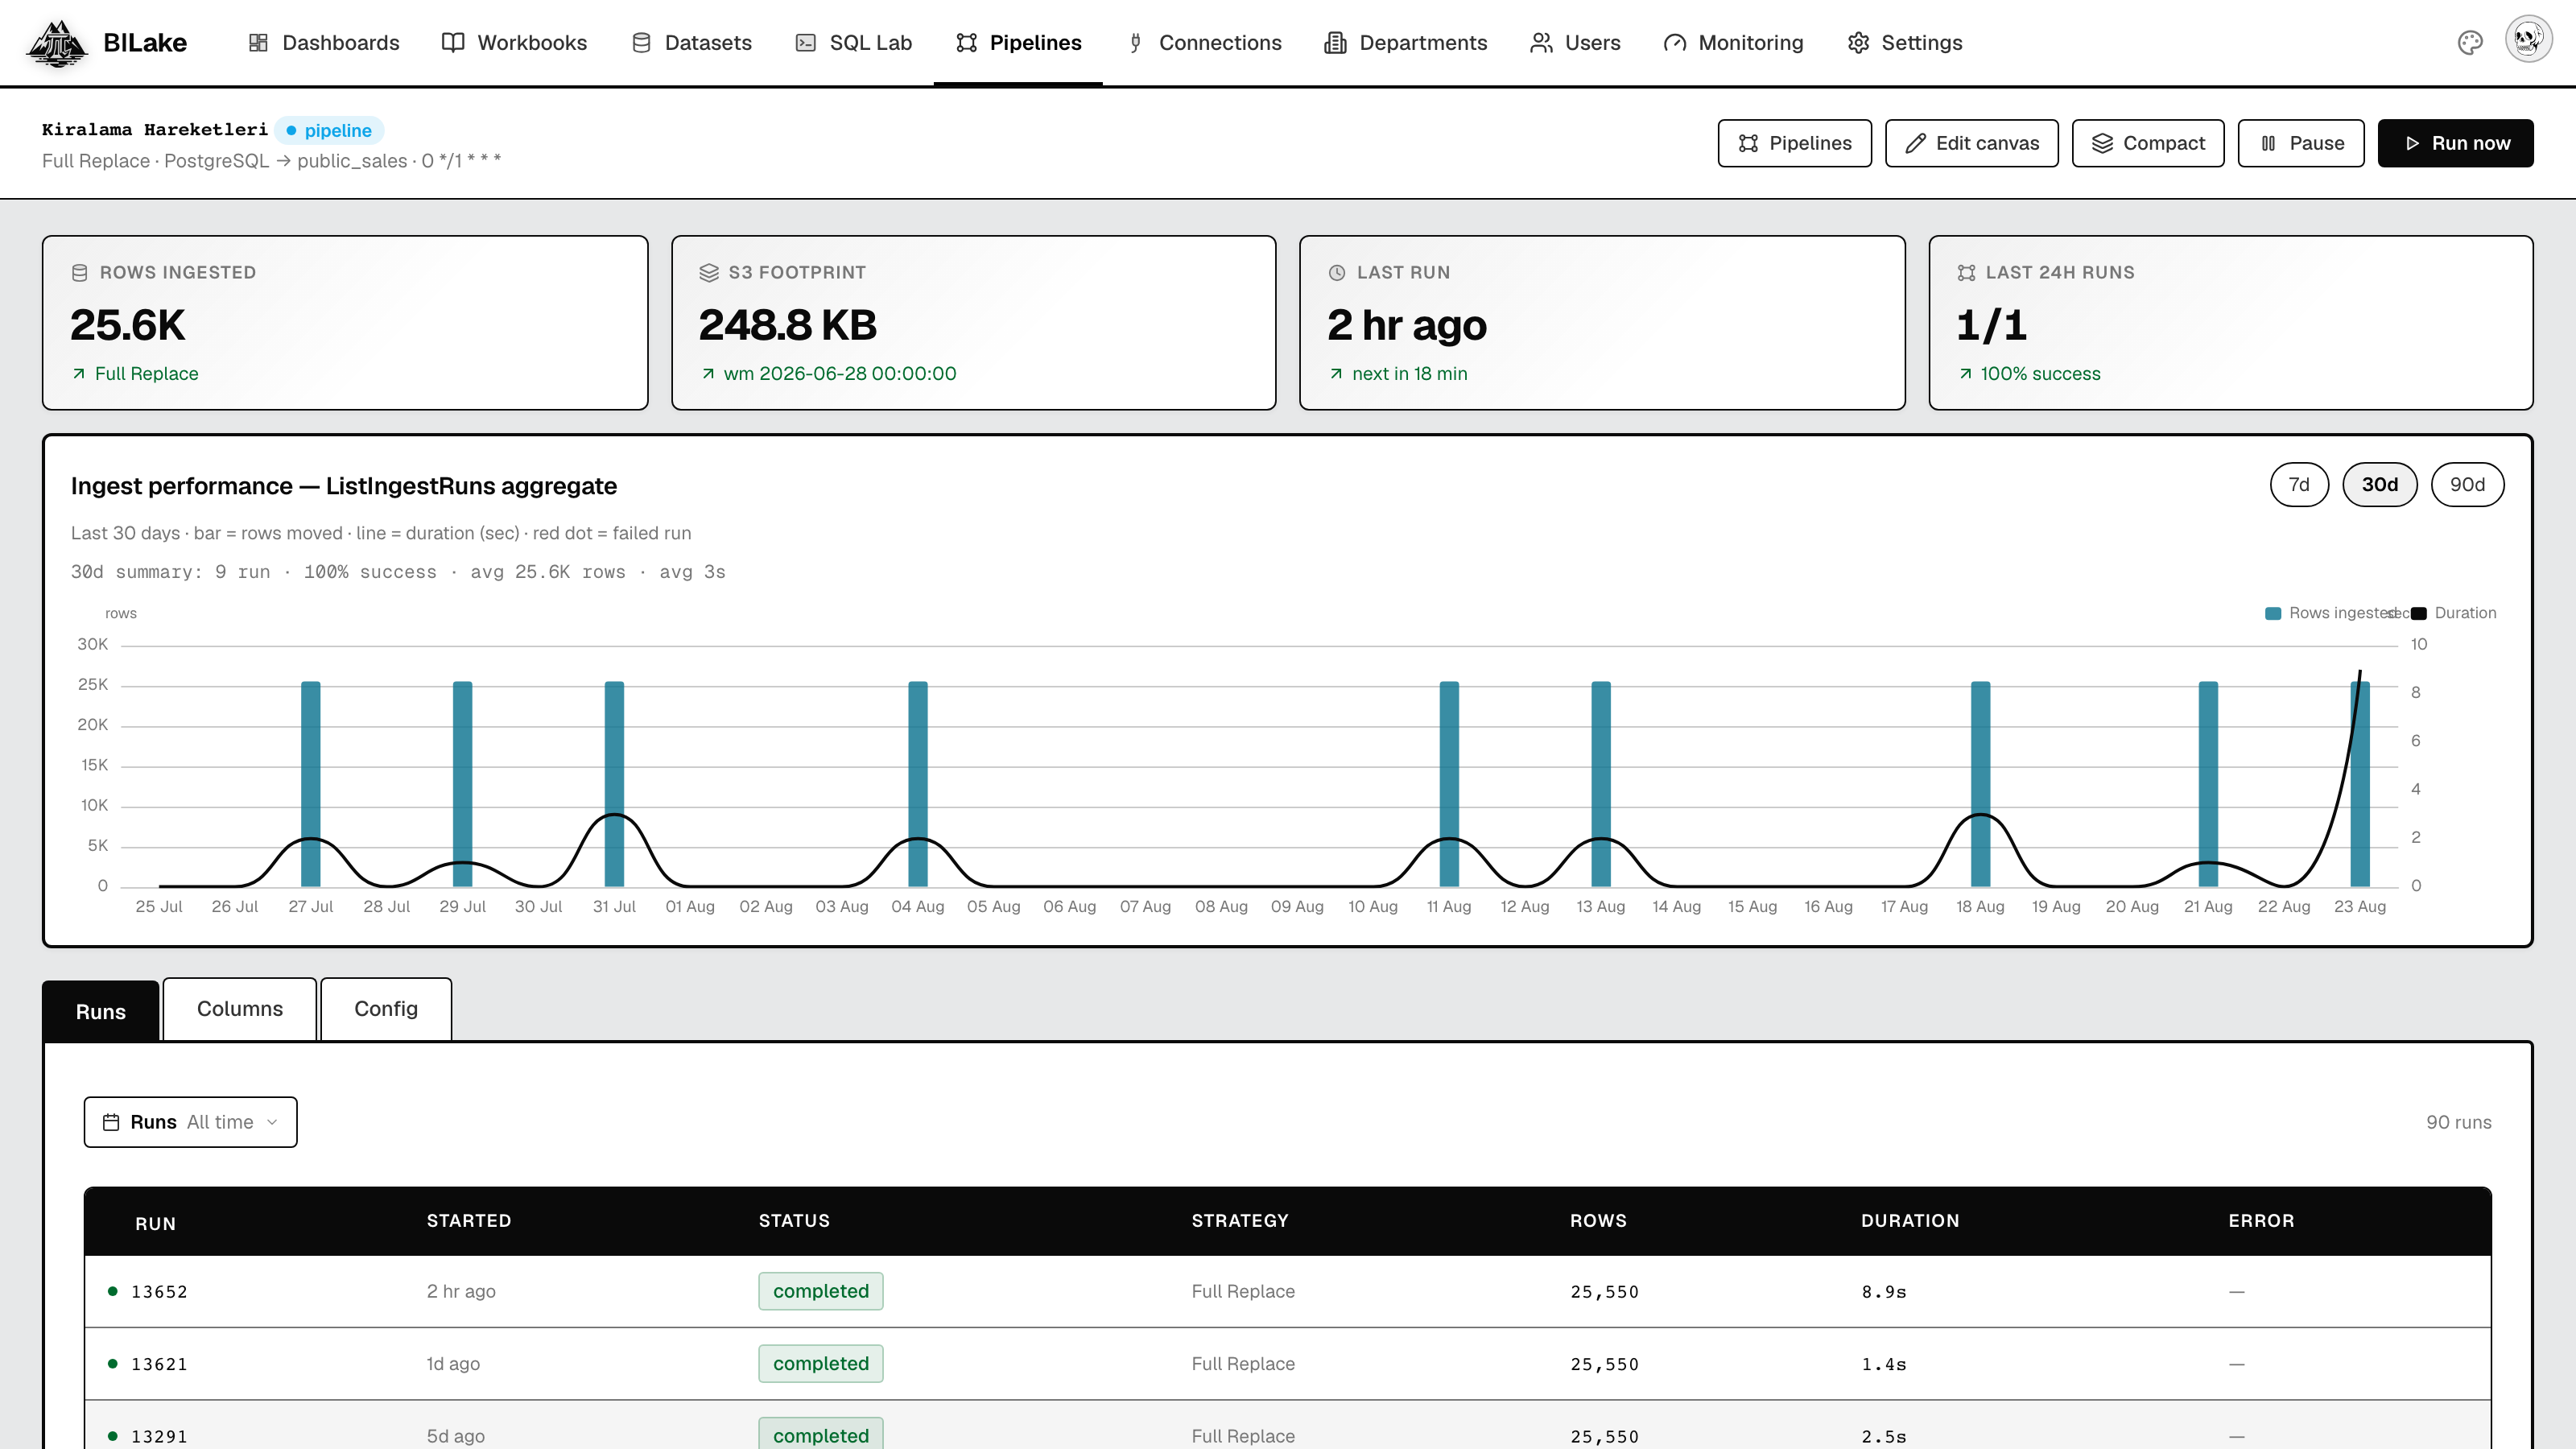
Live product: rows, storage footprint, runs, and maintenance on the same screen
01Last completed view
While a load is running, the user sees the previous consistent data; they never meet a half-written table.
Snapshot trust
02Version history
“What did this table look like last month?” is one query, with no hunt for a backup file.
Time travel
03Nightly automatic maintenance
Small files are compacted every night in about 0 seconds; the 42-second freeze of the classic method is gone. No version a dashboard is reading is deleted.
Pin-safe
04BILake Nodes
Read nodes scale out; if one drops, the system fails over without the user noticing.
Scale + failover
Wherever your data will live, BILake runs there.
You choose the deployment model: today the product runs fully on-premises, on your own servers; managed cloud and hybrid are in development. All three are the same product, the same data model, and the same screens; the only thing that changes is where install and operations sit.
TodayOn-premises
The product runs entirely on your servers; data never leaves the organization. Installed with a single command, and you add a machine next to it as need grows. The primary model today for organizations whose data cannot leave by regulation.
RoadmapHybrid
Data stays in your storage; operations sit with us. You hand off install, maintenance, and upgrades without giving up data sovereignty.
In developmentBILake Cloud
A managed cloud in Turkey: install, maintenance, and scale sit with us; you use it from a browser. Data never leaves the country.
On-premises: starts on one machine, grows by adding pieces
When load grows you add a machine for reads, writes, or both: same product, same data, just more pieces. No variation requires a reinstall, a data move, or an architecture change.
Single machineStart
Machine 1
APISchedulerLoadRead
All roles together, in one box. A setup that lasts years for most organizations.
+ Read machineBILake Node
Machine 1
APISchedulerLoadRead
Machine 2
Read
As dashboard users grow, a read node is added; requests fan out, and if one drops the other takes over.
+ Write machineLoad worker
Machine 1
APISchedulerRead
Machine 2
LoadLoad
As pipelines multiply, load moves to a separate machine; nightly runs do not touch dashboard traffic.
Full helper machineRead + write
Machine 1
APISchedulerLoadRead
Machine 2
ReadLoad
One machine, two contributions: added to the read pool and to load capacity at the same time.
The capacity limit is storage, not the product:open Parquet + object storage = petabyte scale· proof is taken on your data
Your data is already ready for tomorrow’s AI teams.
In the AI era the most valuable asset is not the model; it is clean, trusted data. In BILake your data is already in the form AI wants: open Parquet files are what every modern data-science tool reads directly — no export, no transform pipeline, no per-team copy. The data the dashboard shows and the data a model would train on are literally the same files; thanks to version history, “train the model on last month’s data” is a single query.
The same data layer · the same files for the dashboard and for the AI agent
RoadmapMCP support
AI agents connect to BILake data over a standard protocol: your own assistant queries from inside your permission model, without making a copy.
DiscoveryAI-assisted analysis
Write the question in natural language; BILake drafts the chart and the dashboard. Even easier than dragging shelves.
RoadmapCRM and ads connectors
Next to your databases, marketing and sales service data join the same no-code flow.
In developmentBILake Cloud
A managed cloud in Turkey: used from a browser, with no operations burden, and data that never leaves the country.
How many products does the same job take?
The usual way to build this chain runs through several separate products: Fivetran or Airbyte to pull and move data, Airflow to schedule runs, Spark for heavy transforms, a warehouse to store, Power BI or Tableau to show. Each means a separate license, a separate install, a separate specialty. The real work is keeping the joints between them. BILake collapses the whole chain into one product: connection, load, storage, and dashboard live in the same screens. The table below is not here to shrink competitors; it is here to show where each product sits on the chain. Each is good at its target. The difference is where the scope ends.
Swipe the table →
Feature
BILake
Power BI
Tableau
Superset
Fivetran
Data movement included
Yes
Separate module
Separate product
No
Yes
Visualization included
Yes
Yes
Yes
Yes
No
Own storage layer
Open files
Closed format
Closed format
Warehouse required
Warehouse required
Can another tool read it
Directly
No
No
—
Depends on the target
Half-written data protection
Guaranteed in the product
Depends on refresh
Depends on refresh
Depends on the warehouse
Depends on the target
Full on-premises install
Single command
Limited
With an extra server
Many components
Control in the cloud
BILake is the right choice when
Moving data and showing it is the same team’s job
The team has no engineer to write pipeline code, or wants that time for something else
Most users do not know SQL
Data cannot leave the organization by regulation
Per-seat licensing cannot be sustained as user count grows
The AI team will use the same data
You do not want to stand up and run a separate warehouse cluster
 BILake
 PostgreSQL
 MySQL
MySQL
 MariaDB
 ClickHouse
 Snowflake
 BigQuery
 Databricks
75+ connector types
Databricks
75+ connector types
 Kafka
Kafka
 MongoDB
 Elasticsearch
 Trino
Trino
 DuckDB
 Apache Doris